|
|
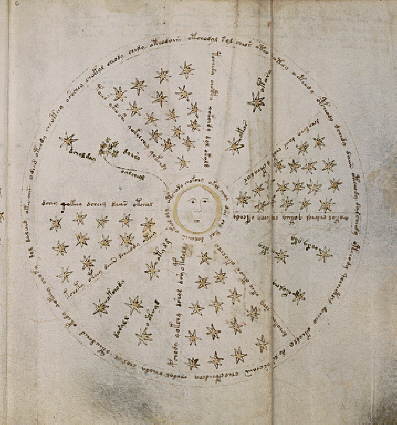
| f68r, right, Voynich Manuscript. Credit: Beinecke Rare Book and Manuscript Library, Yale University. |
f68r RIGHT
One of the labels on this page and its possible translation provides the basis of my theory.
|
|
| f68r, right, Voynich Manuscript. Credit: Beinecke Rare Book and Manuscript Library, Yale University. |
The label in question is one in the section described as the P-M or Pleiades moon curve sector.
|
|
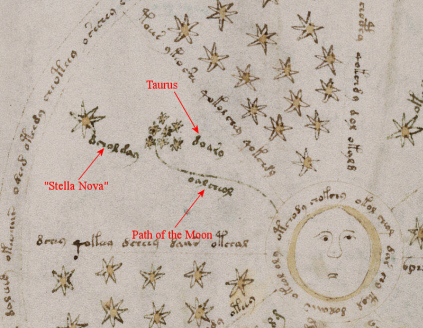
| f68r, right, cropped, Voynich Manuscript. Credit: Beinecke Rare Book and Manuscript Library, Yale University. Overlay by P. Han, indicating possible label translations. |
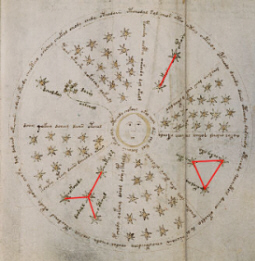
The label in question is the one below the large star on the left, in EVA=dcholday. I translated this first using my own method of translation as "sol natus" or “sol natus est” in 2008, and later as my method developed as “stella nova est”. However the original “sol natus” captures its very essence, the death of a star, a nova, is first observed on earth as a new star, effectively a “sun born” in the unchanging sky where before it was not. My theory for the whole of the Voynich Manuscript therefore revolves around the subject of astronomy and in particular the supernova. I propose two supernovas are portrayed in the Voynich manuscript, the first SN 1054 based on information brought back from China and the second SN 1572, Tycho’s supernova from a European point of view. I also propose that a mixture of Chinese and European astronomy exist side by side throughout the manuscript. The plant section is not included in this except a very speculative look at some images for astronomical symbolism, astronomy and medicine often occurred side by side in manuscripts so the plant section is likely to be a separate issue here also.
The P-M section I therefore consider is a record of a supernova. The seven stars portrayed have been much debated over whether they could be the Pleiades, and I would say "yes" to this. The label to the top side of the seven stars can be translated as a word similar to the Latin for sister – but not quite, however it fits Taurus perfectly, so not seven sisters but the image “seven stars” in Taurus would only refer to the Pleiades. The label below the wavy line between the moon and the seven stars I translate literally as “path/ line of the moon”. Putting this all together and looking at all the naked eye supernovas that have been recorded, the image best fits SN 1054 which occurred in Taurus. The path of the moon above would however be recorded from before the supernova, and as supernova happen without warning it seems logical that something else was being recorded and tracked in this area of the sky when the supernova “happened” upon the observers. I propose a comet of low magnitude was being recorded and that a possible comet occurs in the right place and images in the Voynich Manuscript support a comet present. If this data was from Europe this scenario would be unlikely but in China, it would be a very different matter and records were made on a daily basis down to the smallest change in the sky.
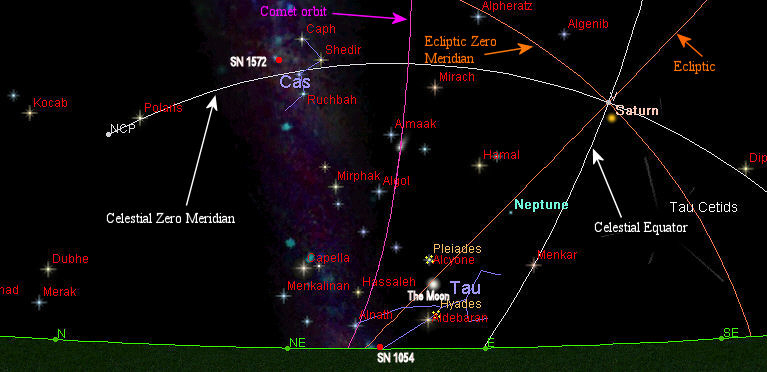
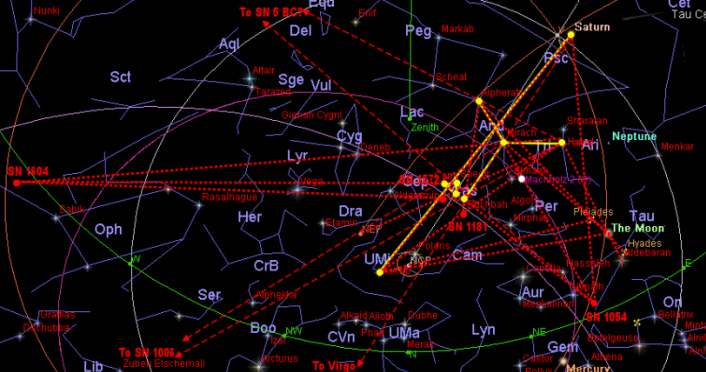
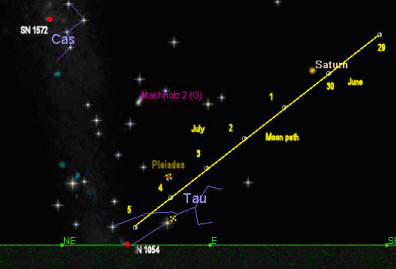
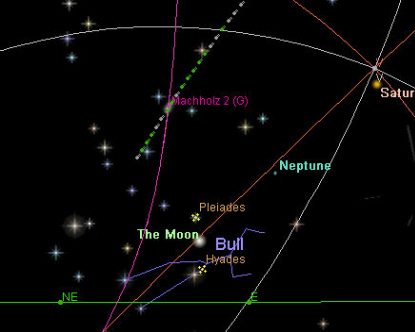
In the days before the supernova dated around July 4th 1054 the moon did indeed sweep down past the Pleiades, and on the 4th of July it was under the Pleiades and by the 5th it would have been on the other side of Taurus nearer the supernova. The sky map below is set in the capital of the Song dynasty of China at the time of the rising of the supernova on the 4th July, other stars, planets and lines of astronomical measurement are also shown. This is the area of space that I will be comparing to the pages of the astronomical section of the Voynich Manuscript and comparing the real data provided by astronomy software to the data provided by the markers in the Voynich Manuscript. I would not expect perfect fits given how old the manuscript is, although Tycho Brahe achieved remarkable accuracy and once the telescope was in serious use accuracy increased to new levels. I suggest that the images themselves give an overall setting of the scene but are not meant to be mathematically accurate and the markers provide the accurate data, as far as was possible at the time it was written.
|
|
| Credit: Redshift6. Horizon based view of sky on appearance of SN 1054, 4/7/1054 AD. North China. Overlay by P. Han with labels and noting position of SN 1054, SN 1572 and comet. |
Suggested match of stars on the Voynich Manuscript image to real star groups in the European horizon style sky view:
 |
 |
| f68r, right, Voynich Manuscript. Credit: Beinecke Rare Book and Manuscript Library, Yale University. Overlay by P. Han showing possible star configurations in various sectors. | Credit: Redshift6. Horizon based view of sky on appearance of SN 1054, 4/7/1054 AD. North China. Overlay by P. Han with labels and noting position of SN 1054, SN 1572 and comet. Comparison with possible star configurations on f68r. |
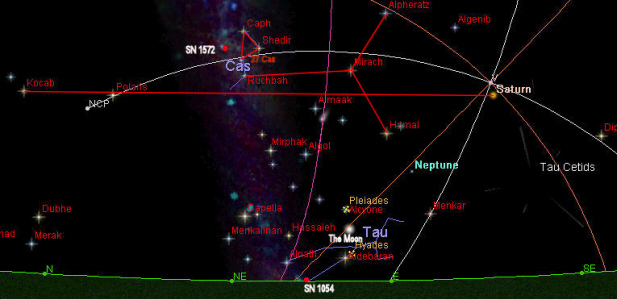
The two stars at 1 o’clock I specifically translate as "Kokab" and "Saturn". Kokab is an interesting star in that it was once the pole star and occasionally it has been used to refer to “pole star” when meaning Polaris, as Kokab its self it may indicate the horizontal with Saturn at its point near the Vernal equinox. As Polaris it may mean in conjunction with Saturn the Celestial Meridian which these stars in general are situated, also Cassiopeia with SN 1572 is located within this data as the triangle of stars. The common relation of SN 1054 and SN 1572 in relation to the milky way can be seen in this sky map, as can the moon in its position below the Pleiades. The patterns can be seen more clearly in a map of this specific area with just the brightest stars showing.
|
|
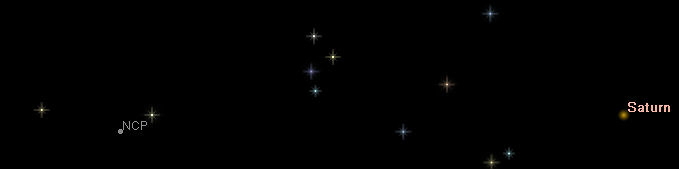
| Credit: Redshift6. Comparison of actual star map (brightest stars in sector) with star configurations on f68r. |
If the three star clusters are highlighted on a North Pole centred star map then these stars (and Saturn) may be used to triangulate various stars, star clusters, the Moon, and supernovae, particularly SN 1572 in relation to SN 1054, but also extending to mark the positions of the supernovae which have been speculatively mentioned.
|
|
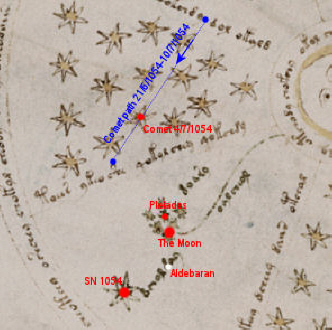
| Credit: Redshift6. North Pole centred star map, 4/7/1054. North China. Overlay by P. Han showing various ways the star clusters suggested and Saturn may be used to triangulate the positions of stars, star clusters, the Moon, and supernovae on such a map. Star clusters suggested (yellow), positions of supernovae (red) and comet (white), |
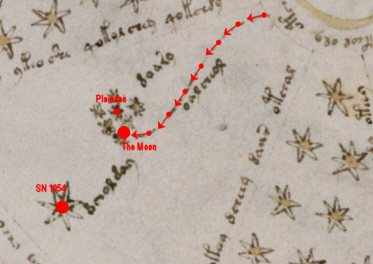
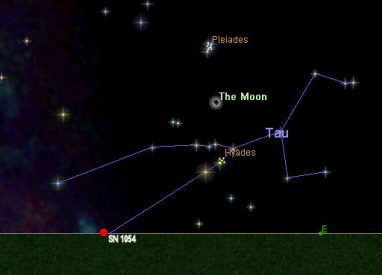
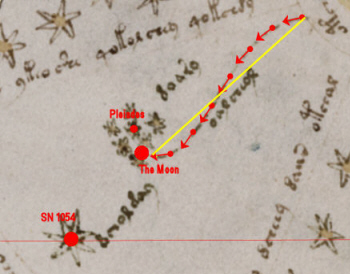
Remembering that I suggest the images are overviews and rough positions only, I propose this overlay is representative of the Pleiades, SN 1054 and the Moon shown with its rough end position and previous path on the Voynich Manuscript image. Next to it is a comparison of the actual positions of the Pleiades, Moon, and SN 1054 rising on 4th July 1054.
|
|
|
| f68r, right, cropped, Voynich Manuscript. Credit: Beinecke Rare Book and Manuscript Library, Yale University. Overlay by P. Han showing possible interpretation of P-M curve sector compared to actual star map | Credit: Redshift6. Horizon based view of sky on appearance of SN 1054, 4/7/1054. North China. Overlay by P. Han with labels and noting position of SN 1054 AD. |
In conclusion, I suggest this image shows the location of SN 1054 (and SN 1572) in relation to stars on the Celestial Meridian, the Moon and the Pleiades.
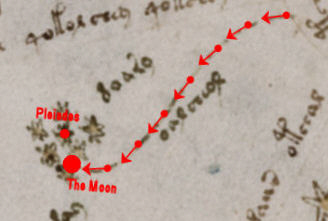
The path of the moon is unusual having such a pronounced two directional curve rather than the straight path expected on a horizon style map or the circular path on a pole centred map. I suggest that although it shows the path of the moon it contains much more information about the moon at this point which accounts for the curvature. The image below shows the path of the moon from the 29th June 1054 AD to 5th July 1054 AD, and as expected it is a straight line in this view. If the curve of the moon in the Voynich image is joined end to end, it follows this path almost exactly, from the 1st to the 4th July. The curvature I suggest corresponds to the section of the moons orbit at this time as shown on a graph of Right Accession (RA) v Declination (Dec), or Azimuth (Azm) v Altitude (Alt) over time. Azm and Alt are observer centred local coordinates and change depending on location. RA and Dec are coordinates as would be seen from the centre of the earth and so global and constant. A negative Altitude indicates an object is below the horizon as does a negative Declination, the local coordinates are given at midnight which at this time means the moon has negative Alt coordinates but the shape of the graph is still correct. The curve as seen on this type of graph is accounted for by the movement of the moon above and below the visible horizon along its orbit. Alternatively, the curve could just be a method of conveying movement.
|
|
|
| Credit: Redshift6. Horizon based view of sky on appearance of SN 1054, 4/7/1054. North China. Overlay by P. Han noting position of SN 1054, SN 1572 and the path of the Moon from 29/6/1054-5/7/1054 AD. | f68r, right, cropped, Voynich Manuscript. Credit: Beinecke Rare Book and Manuscript Library, Yale University. Overlay by P. Han showing possible interpretation of P-M curve sector compared to actual star map, and path of the Moon from 1st-4th July 1054 AD. |
Much work has been done on this curve by Berj N. Ensanian, I intend to examine the curve in more detail purely from the point of view of my theory. The curve has been dubbed the “P-M” or “Pleiades- Moon” curve although others have stressed that they have examined the curve mathematically and not necessarily attributed it to the Pleiades although the possibility is left open. As my theory places f68r in the sky of the 1054 AD supernova including the Pleiades my theory supports the idea that the 7 stars shown are indeed the Pleiades and my images above showing the moon over a few days before the supernova in correlation to the actual Voynich Manuscript image supports the idea that the curve is correlated to the moon at this time. I have prepared a number of graphs of various aspects of the moon at this time based on the Altitude/Azimuth horizontal co-ordinate system to examine the moon in the specific locality of the Capital of the Song dynasty in North China at this time. The Altitude/Azimuth horizontal co-ordinate system is specific to the local of the onlooker. Altitude provides the vertical position in degrees measured between the local horizon and the object, on the horizon it is 0°. Above the horizon the measurement is positive, peaking at 90° at the zenith and negative below the horizon, peaking at -90° at the nadir. Azimuth measures the horizontal position in degrees also, ranging from 0°-360° in a circle around the earth, starting from the observers north, east is 90°, south 180°, west 270° and back to north 0° /360°.
|
|
|
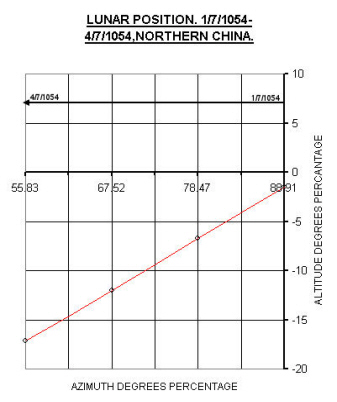
| f68r, right, cropped, Voynich Manuscript. Credit: Beinecke Rare Book and Manuscript Library, Yale University. Overlay by P. Han showing possible interpretation of P-M curve sector compared to actual star map, and path of the Moon from 1st-4th July 1054 AD. | Graph by P. Han showing lunar position (Alt/Az) 1/7/1054-4/7/1054, the time frame corresponding to the actual direct comparative length of the P-M curve in relation to the Pleiades and SN 1054. |
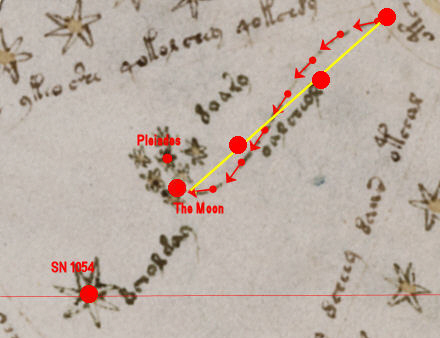
Keeping the scaling the same as the example from f86r
for comparison, the yellow line that follows the moons path can be seen to
correspond to a graph of the Moons positions from 1/7/1054 - 4/7/1054 AD in
North China. The path of the Moon however does not appear to account for the
curved line found on f86r. I suggest one of two possible explanations to account
for the curve, the general part of the lunar orbit these days occurred in or the
phase of the moon they occurred in. If the position of the Moon is plotted on a
graph over time as viewed from the horizon you get a curve rather than a
straight line, as the Moon progresses round on its path. Below is a basic chart
of this, the horizontal line is the horizon and below this point, it is not
visible to the observer.
|
|
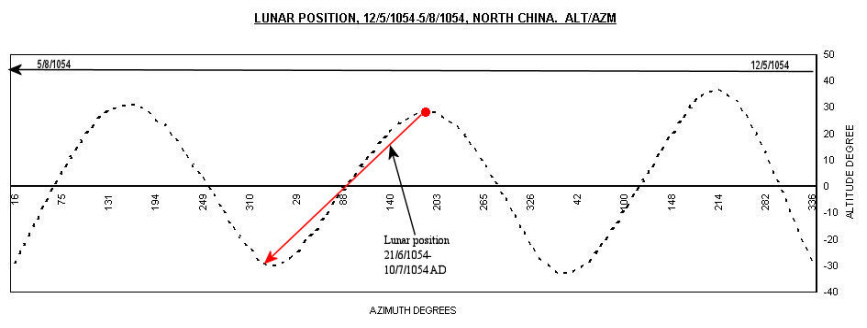
| Graph by P. Han showing lunar position (Alt/Az) over several months revealing the general cycle and the place of the time relating to the appearance of SN 1054 within this cycle. |
I suggest the curve from f68r fits the section around the time of the supernova could represent the phase from highest point above the horizon to the lowest point below the horizon. Alternatively the curve of a graph showing Moon phases from full Moon to no Moon also follows a similar curve. It seems most likely from the fit of these curves that the curve on f68r is not accidental, free drawn or whimsical but is indeed a deliberately placed and carefully plotted curve, containing information relating to the activity of the Moon around the time of the supernova, indicated on the graph above as opposed to any other possible points on the graph.
|
|
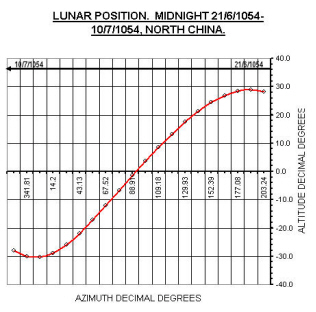
| f68r, right, cropped, Voynich Manuscript. Credit: Beinecke Rare Book and Manuscript Library, Yale University. Overlay by P. Han comparing shape of P-M curve to graphs of lunar position and Moon phase (21/6/1054-10/7/1054). |
|
|
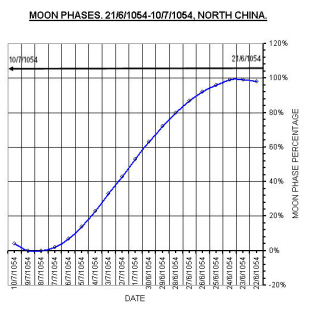 |
| Graph by P. Han showing Lunar position (Alt/Az) from 21/6/1054-10/7/1054, North China. | Graph by P. Han showing Moon phases from 21/6/1054-10/7/1054, North China. |
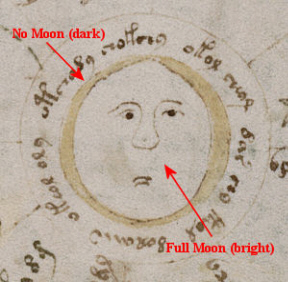
I suggest the appearance of the “Moon” face below from f86r is also accounted for by the cycle of Moon phases at this time, and represents a full (bright) Moon superimposed over no (dark) Moon. The graph above showing Moon phases indicates that from 21/6/1054-10/7/1054 the Moon did in fact proceed from full Moon to new Moon.
|
|
| f68r, right, central image, Voynich Manuscript. Credit: Beinecke Rare Book and Manuscript Library, Yale University. Overlay by P. Han showing possible interpretation of central Moon face. |
Currently I have no suggestions for the sectors with many stars, except that in the upper sector (10 -12 O’clock) one star corresponds to the position of the possible comet, mentioned at the top of the page, on 4/7/1054 AD. Further work needs to be done on this aspect but the numerous stars may just indicate “night” or the “starry sky” in general.
|
|
|
| f68r, right, cropped, Voynich Manuscript. Credit: Beinecke Rare Book and Manuscript Library, Yale University. Overlay by P. Han showing possible path of comet Machholtz 2 (G) on the folio and its position on 4/7/1054 AD. | Credit: Redshift6. Horizon based view of sky on appearance of SN 1054, 4/7/1054. North China. Overlay by P. Han noting projected path of comet Machholtz 2 (G) from 21/6/1054-10/7/1054 AD. |
![]()
Copyright © 2010 P. Han